Spectrometer Software (UI)
The following LabVIEW User Interface was for an AES (Atomic Emission Spectroscopy) demonstration unit which would be open to the public. As such, an extremely simple and intuitive User Interface was required.
The main wish of the customer was to be able to intuitively recognise which colours were being emitted when solutions of different salts are burned in a flame. We all know, thanks to "sodium lights" responsible for street illumination, that sodium burns with a yellow colour.
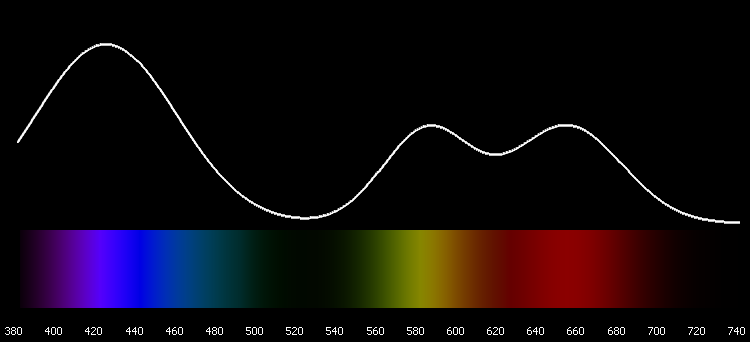
By generating a real-time colour bar (lower portion of the picture above), the user has an instant feedback as to what exactly is going on. It also serves as a rudimentary introduction to the nature of wavelength in relation to colours.
The basic algorithm was found here. Although it is only a rough estimate of the "true" colours at specific wavelengths, it was found suitable for this use. A LabVIEW VI for converting a given wavelength to a RGB colour can be downloaded HERE.
By heavily optimising some built-in picture functions within LabVIEW, it was possible to get a refresh rate quick enough to dynamically create the colour bar (>30Hz).
The behind-the-scenes operation was handled by a spectrometer driver suite interfacing to a miniature CMOS spectrometer. Driver integration was performed via DLL-import from an existing supplier driver.